How to Calculate a Stock’s Beta – A Practical Walkthrough

Once you understand the what the beta of a stock is and what it represents from a finance and a risk perspective, the next step is calculating it. Reading the theory behind the beta is important, but at some point actually calculating a stock’s beta for yourself will prove more useful than reading another paragraph of finance theory. Here, we’ll walk through a basic example of how to calculate the beta using MS Excel. We’ll use the S&P 500 as a proxy for the market and we’ll calculate the beta of Facebook (FB) stock.
Step 1: Obtain Daily Prices for One Year
The first step is to obtain daily prices of both the S&P 500 and the stock we’re looking at (Facebook in this case) for a period of 1 year. We’ll want at least one year’s worth of prices in order to capture a full year’s economic cycle, include all of the seasons, holidays, and any unique things that might influence the market over the course of a year in our data set.
We’ll want to make sure that the dates align – we want to make sure that for every day we have both an S&P 500 piece and an FB price. Basically, what you want to avoid is a situation where you have the S&P 500 price for a day but don’t have the FB price for that same day (or vice versa). This should be easy if you’re using stocks from the US as bank holidays will generally coincide.
A final point to note is that you’ll want the adjusted closing price for each day (as opposed to the general closing price). The adjusted closing price takes things like stock splits into account. Imagine a stock split occurred for the stock you’re analyzing halfway through your yearly timeframe – this would make it seem like there was a huge price drop. To avoid this, adjusted closing prices (which are readily available online alongside normal historical closing prices) take this into account and provide (usually) a post-split price for the entire timeframe.
As to where to obtain the data, that should be easy in today’s world – you can go to any of the major finance websites to download historical data or you might use your own brokerage account’s platform. You can also use a paid data provider, but that’s not a necessary expense for most people.
Step 2: Get the Data Neatly Into the Same Excel File
Next, you’ll want to copy the data into the same Excel file so you can work with it. This should be easy. Take care to leave a few columns between the data so that you can do the next calculations we’ll go over below.
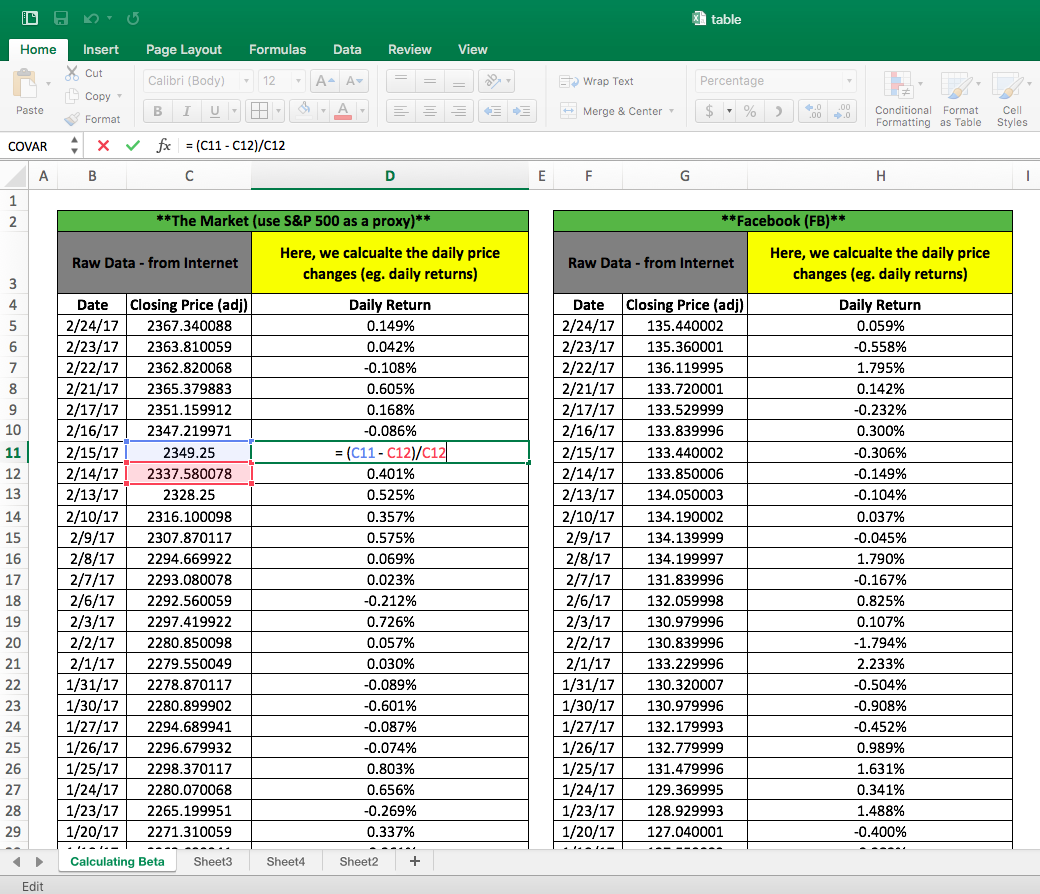
Step 3: Calculate Daily Returns
Next, you’ll want to calculate daily returns (eg. daily price changes) for the S&P 500 and FB. This can be done in two ways:
simple return: (today – yesterday)/yesterday
log return: ln(today/yesterday)
For the most part, simple returns will suffice. Sometimes log returns are useful because they inherently assist with normalizing the data, but that’s both beyond the scope of this discussion and unnecessary for us here.
It’s easy to calculate simple daily returns in Excel (see the formula in the image below). Once you have a single cell filled out, you can drag the cell all the way to the bottom to create a time series of daily returns for both the S&P 500 and FB.
Note that for the very final day (here it will be the first day in our time series), you won’t be able to calculate a return – you’ll get an error message in Excel. This is because you won’t have a price for the previous day and you’ll effectively be dividing by zero. This is not relevant for our purposes and this can safely be ignored.
Recall that the beta can be calculated by using the following formula:beta = cov(x,y)/var(x)where x is the stock and y is the S&P 500 and where var(x) does not equal 0.So, we must calculate two things:
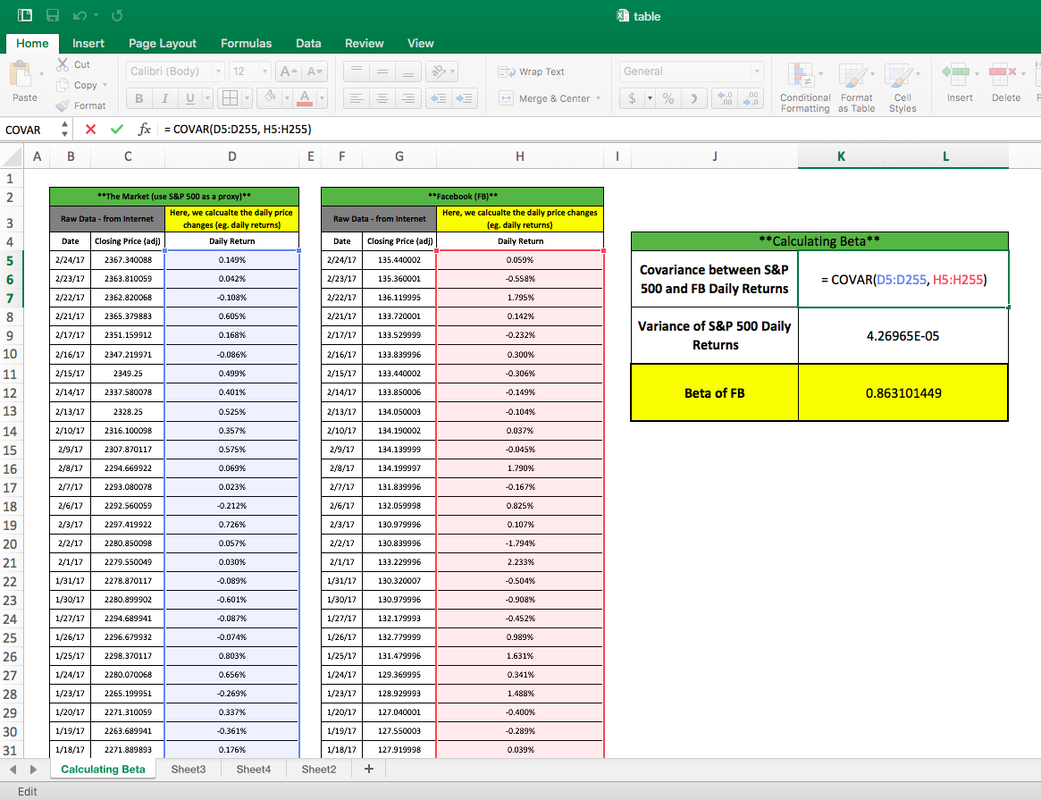
- covariance between daily returns for the S&P 500 and the daily returns for FB
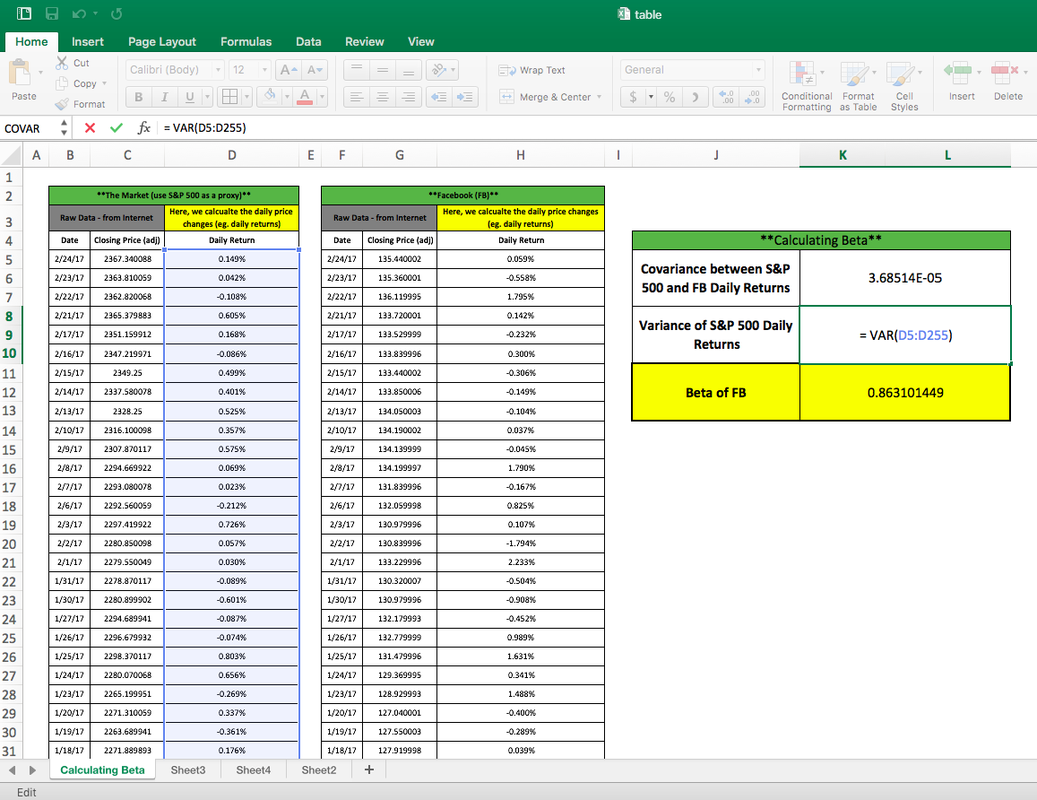
- the variance of daily returns for the S&P 500
You can see this in the below images – notice the highlighted formulas and the sections of the Excel sheet they reference.
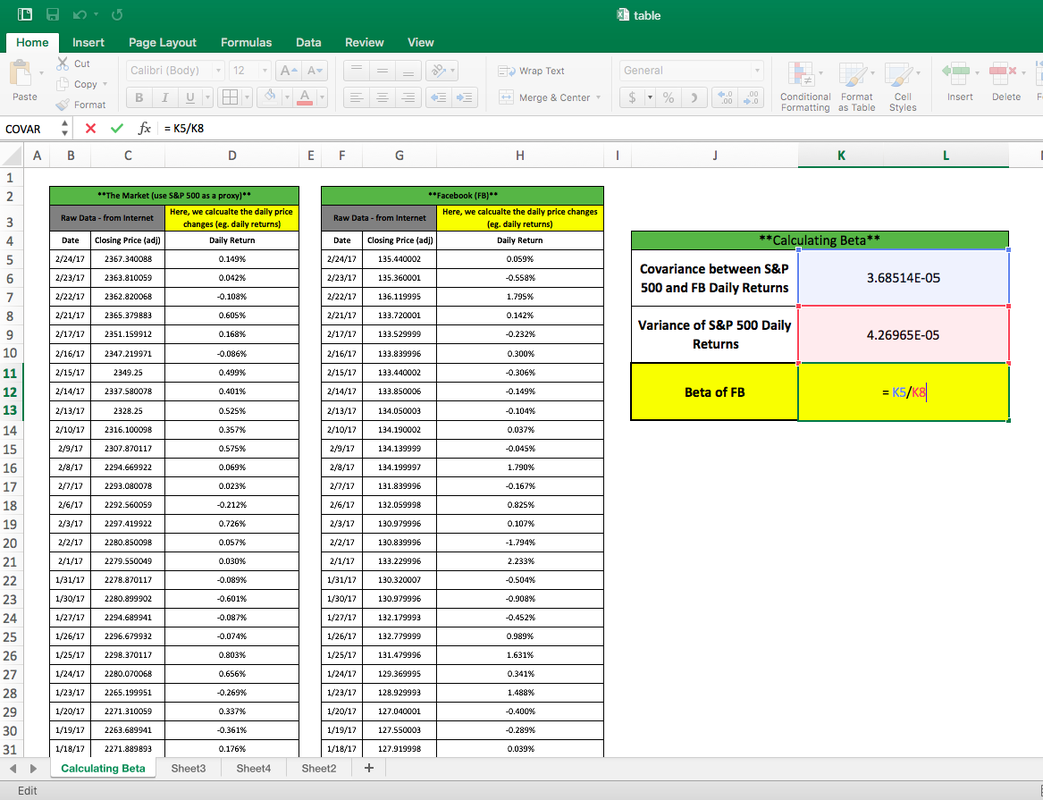
Finally, you simply divide the two obtained numbers per the above formula – notice this in the image below where we divide the obtained covariance by the obtained variance.
We now have our beta for FB – it’s 0.861 as of the end of February 2017 – remember that this can change as the market changes and as Facebook changes. We’ll notice that the beta is less than 1 – this means that Facebook stock is less volatile than the market (as represented by the S&P 500).
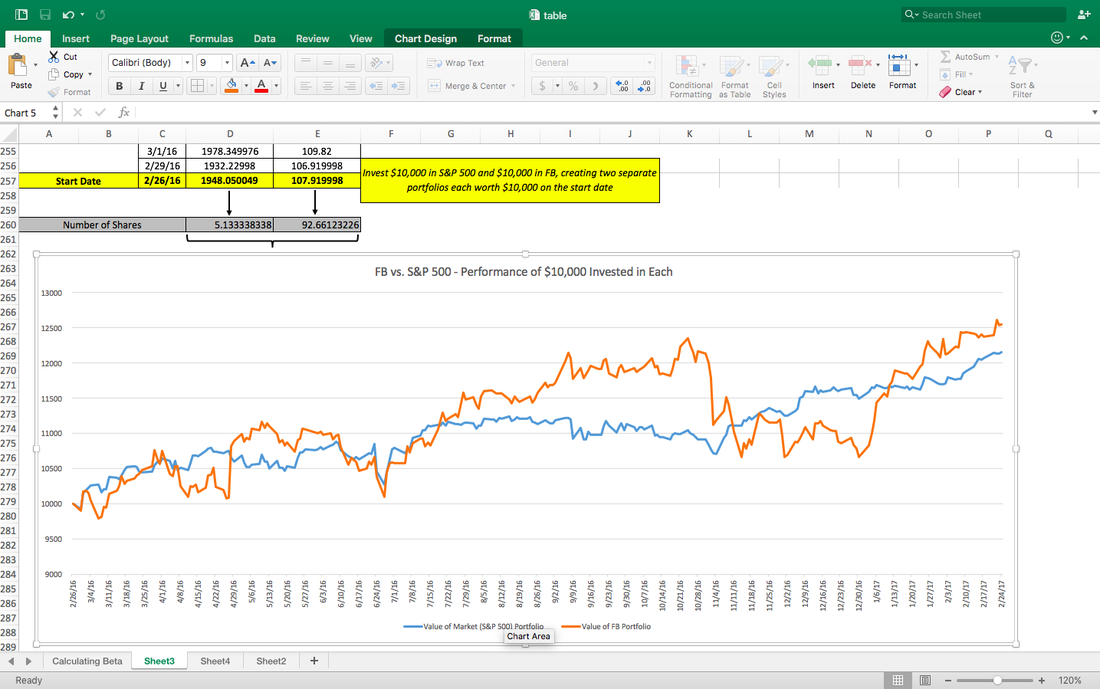
We now have our beta, but let’s go even deeper to build some intuition around the number. Below, we have created two portoflios, each consisting of $10,000 – at the outset, we invest the full $10,000 in either the S&P 500 or Facebook. So, at the beginning of our time series (February 26, 2016), we have the following:
- a portfolio made up of only of the S&P 500 (this can be achieved via some sort of ETF that tracks the S&P 500) – the $10,000 buys us 5.1334 shares of the S&P 500
- another portfolio made up of only FB stock – the $10,000 buys us 92.661 shares
We’re doing this because we need to somehow compare the prices – if we only look at the movement of one share of the S&P 500 vs one share of FB, we won’t get a clear picture because the starting numbers are different. What we care about is not the absolute amounts, but the relative movements of both.
Below you’ll see a graph of how the portfolio would have moved throughout the year – this is literally what would have happened had $10,000 been invested as we described above. Here we see some interesting things:

